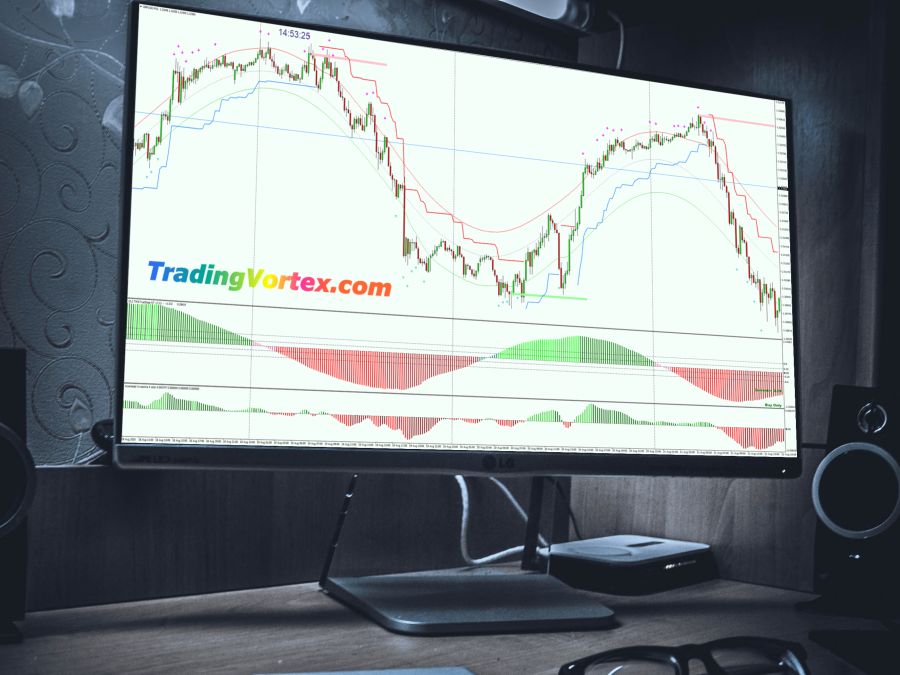
Accelerated Awesome System Overview:
Click on the image to open the full size version!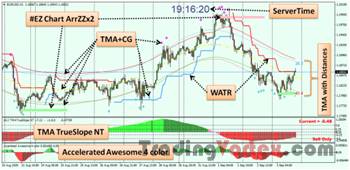
#EZ Chart ArrZZx2:
- This indicator is represented on the main chart window as Thick Horizontal Pink and Pale Green Bars and shows strong support and resistance levels: the Pink Bar is a resistance level while the Pale Green one is a support.
- The role of this indicator is to identify reversal areas: when a reversal is expected the indicator draws a Small Blue Square which will give way to a Thick Pale Green or Pink line when the reversal zone is confirmed.
TMA+CG:
It is a combination of two Different Indicators that have complementary functions:
- TMA: is represented by the envelope delimited between the Red and Green lines on the main trading window. These lines in addition to the dotted line in the middle are actually deviations from moving averages. The market tends to move within these parallel channels.
- The Green and Red Lines can be used as dynamic support and resistance levels: the Green one tends to stay below candlesticks and shows the dynamic support levels, while the Red line tends to stay above market price and shows the dynamic resistance levels. You can see clearly that the price tends to change the direction when it touches one of these two lines.
- CG: This indicator is represented by the Pink and Blue Arrows that you can see on the main chart window. It gives you clear signals to Enter/Exit a trade based on market trends.
- TMA+CG indicator can be personalized to alert you of Entry/Exit opportunities by messages, sounds and/or by sending emails.
TMA with Distances:
- This indicator, although it is forgotten by most traders using this system, is a very useful tool. It indicates at each moment the number of pips which separate the dynamic resistance and support levels represented by the edges of the TMA envelope.
- The indicator can also be configured to alert you when the price goes outside this envelope.
TMA TrueSlope NT:
- This indicator appears in a separate window and consists of a histogram with multicolored bars that fluctuate in positive and negative territory.
- This oscillating indicator offers a global view of the market trend by combining both direction and strength to give you clear answer on when to open buy or sell orders.
Accelerated Awesome 4 color nmc:
- This Momentum Oscillator appears in the second separate window. It consists of a histogram with 4 colored bars (LimeGreen, DarkGreen, Red, Maroon) which fluctuate in positive and negative territories.
- This indicator which gives its name to the whole system, measures the acceleration of price movement, it can be used as a trend confirmation signal, as well as a trend reversal signal.
WATR:
- On the main chart, this indicator is represented by Blue and Red lines.
- It helps you quickly determine the direction of the trend and choose the stop loss level.
- When the line is blue the trend is bullish and the stop loss must be placed below this line.
- When the line is red the trend is bearish and the stop loss must be placed above this line.
AutoRefresh:
- As its name suggests, this indicator allows a periodic refresh of the chart.
- The refresh period is determined in seconds: the default value is PeriodSec = 900.
ServerTime:
- This indicator shows your broker's time directly on the chart.
Accelerated Awesome Forex System MT4 Installation:
Step 1:
- Open your MT4 platform.
Click on File then Open Data Folder. Here you will find a folder called MQL4, this is the new “home” for all your .ex4 or .mq4 files you have.
Open folder MQL4. Here you will find Indicators folder. Copy all 8 indicators "present in the indicators folder" you downloaded from our site into MQL4/Indicators folder. Do this by right clicking on each file and clicking “copy” and then “paste”. - The folder called templates is the home for all your ".tpl" files: put "Accelerated_Awesome.tpl" here.
Restart your MT4.
Click on the image to open the full size version!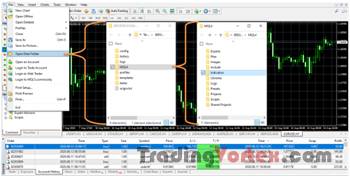
Step 2:
- Open the MetaTrader 4 platform, and click on: → View → Navigator. You can also press CTRL+N.
- When the window titled 'Navigator' will appear click on 'Indicators'.
Click on the image to open the full size version!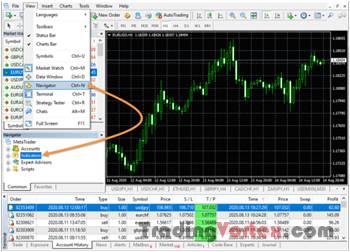
Step 3:
You should found the "#EZ Chart ArrZZx2", "10.2 TMATrueSlope NT v7.13", "Accelerated Awesome 4 color nmc", "AutoRefresh", "ServerTime", "TMA with Distances", "TMA+CG _mqllab-ru" and "WATR" files into the Indicators folder.
You don't have to load the indicators separately on your chart.
How to Setup Accelerated Awesome Forex System?
When the 8 indicators are installed successfully, all what you have to do is apply the template "Accelerated_Awesome.tpl" provided with this system to your chart.
To launch "Accelerated_Awesome.tpl" template:
- Click on "Templates" button to display the list of templates present on your platform.
- Select "Accelerated_Awesome" on the dropdown list.
- If "Accelerated_Awesome" doesn't exist, confirm the presence of "Accelerated_Awesome.tpl" file inside the folder called templates under Open Data Folder and restart your MT4 terminal.
Click on the image to open the full size version!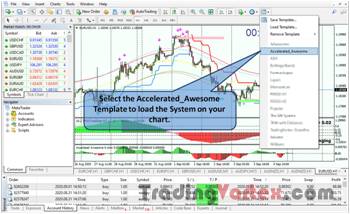
How to use Accelerated Awesome System for trading?
Buy Signal Rules:
Buy triggers when all of the below conditions are met:
- The appearance of the Horizontal Thick Pale Green line is the first signal that must precede any buy order: this line represents the reversal level and therefore signs the start of the trend change. Any previous sell order must be immediately closed when this line appears.
- TMA TrueSlope NT Histogram should show the Lime color which is the optimal color to open a new buy order. This indicator will also tell you when you must open only buy orders.
- The WATR Blue line is drawn below the candlesticks.
- When all of the above conditions are met, the perfect timing is indicated by the Accelerated Awesome 4 color indicator: open the buy order at the first positive Lime Green bar.
- The initial stop loss should be placed below the WATR blue line. You can increase your stop loss level gradually as the price increases to protect your profit.
There are several ways to close buy orders:
- Using the TMA+CG indicator: You can place your take profit at the top edge of the envelope formed by the TMA indicator near the red line ⇔ “Take Profit Level #1 on the example below”.
- You can choose to close the trade manually when the Pink arrow pointing down appears ⇔ “Take Profit Level #1 on the example below”.
- You can turn on the alert to be notified when the price touches the upper red line.
- You can also close the buy order when the Accelerated Awesome 4 color indicator turns red ⇔ “Take Profit Level #2 on the example below”.
- You can wait until the Thick Pink line appears to close buy orders. At this point, no buy order should remain open ⇔ “Take Profit Level #3 on the example below”.
Buy Order Example:
Click on the image to open the full size version!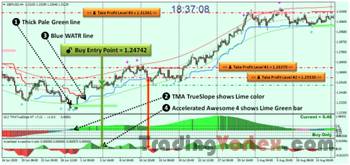
Profit Calculation:
Depending on the Exit Strategy you have chosen, your earnings will be:
- Using the TMA+CG indicator: Profit = 162 pips.
[Take Profit Level #1 = 1.26370] - [Entry level = 1.24742] = 0.01628. - Usingthe Accelerated Awesome 4 color indicator: Profit = 78 pips.
[Take Profit Level #2 = 1.25530] - [Entry level = 1.24742] = 0.00788. - Using the #EZ Chart ArrZZx2 indicator: Profit = 661 pips.
[Take Profit Level #3 = 1.31361] - [Entry level = 1.24742] = 0,06619.
Sell Signal Rules:
Sell triggers when all of the below conditions are met:
- The appearance of the Horizontal Thick Pink line is the first signal that must precede any sell order: this line represents the reversal level and therefore signs the start of the trend change. Any previous buy order must be immediately closed when this line appears.
- TMA TrueSlope NT Histogram should show the red color which is the optimal color to open a new sell order. This indicator will also tell you when you must open only sell orders.
- The WATR Red line is drawn above the candlesticks.
- When all of the above conditions are met, the perfect timing is indicated by the Accelerated Awesome 4 color indicator: open the sell order at the first negative Red bar.
- The initial stop loss should be placed above the WATR red line. You can decrease your stop loss level gradually as the price decreases to protect your profit.
There are several ways to close sell orders:
- Using the TMA+CG indicator: You can place your take profit at the bottom edge of the envelope formed by the TMA indicator near the Lime Green line ⇔ “Take Profit Level #1 on the example below”.
- You can choose to close the trade manually when the MediumTurquoise arrow pointing up appears ⇔ “Take Profit Level #1 on the example below”.
- You can turn on the alert to be notified when the price touches the lower Lime Green line.
- You can also close the sell order when the Accelerated Awesome 4 color indicator turns lime green ⇔ “Take Profit Level #2 on the example below”.
- You can wait until the thick pale green line appears to close sell orders. At this point, no sell order should remain open ⇔ “Take Profit Level #3 on the example below”.
Sell Order Example:
Click on the image to open the full size version!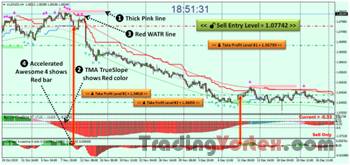
Profit Calculation:
Depending on the Exit Strategy you have chosen, your earnings will be:
Using the TMA+CG indicator: Profit = 95 pips.- [Entry level = 1.07742] - [Take Profit Level #1 = 1.06790] = 0,00952.
- Usingthe Accelerated Awesome 4 color indicator: Profit = 312 pips.
- [Entry level = 1.07742] - [Take Profit Level #2 = 1.04616] = 0,03126.
- Using the #EZ Chart ArrZZx2 indicator: Profit = 368 pips.
- [Entry level = 1.07742] - [Take Profit Level #3 = 1.04059] = 0,03683.
 Accelerated Awesome System Free Download:
Accelerated Awesome System For Metatrader4| 85.66 Ko| 04/09/2020, 23:21








 TradingVortex.com® 2019 © All Rights Reserved.