Table Of Contents:
- Waddah Attar Explosion Indicator Calculation:
- Waddah Attar Explosion MT4 Indicator explained, how it works?
Recommendations for Waddah Attar Explosion:
Waddah Attar Explosion MT4 Installation:
Waddah Attar Explosion Settings:
How to use Waddah Attar Explosion Indicator for trading?
Waddah Attar Explosion Free Download:
Waddah Attar Explosion Indicator Calculation:
This indicator relies on merging two indicators in a special way, which are the Bollinger Bands and MACD. Thanks to this combination you can identify with high accuracy the start of the price explosion situations that occur almost every day, so you can know when this explosions begin and when it end with a high degree of success.
The Indicator Calculation depends on two things to show its data and draw its lines.
The first: is the difference between the upper line and the lower line of the Bollinger Bands indicator, represented by the Golden Line in the indicator.
- It always narrows as prices stabilize and fluctuate in a very narrow range.
- It expands when the price begins to explode and draws a circular curve to return and narrow at the end of the explosion.
The second: It is the difference between the current and the previous MACD with displacing by one candle, represented by the histogram.
- This difference is very sensitive to price ups and downs and without delay, as is the case with the MACD if used alone.
- Represented by the Green bars if the difference is positive and the price goes up and the Red Bars if the difference is negative and the price goes down.
- Each of the Bars formed in the indicator window corresponds to one chart candlestick.
- The height of the Bars shows each candlestick volume and hence the strength of the explosion pushing the market prices in the direction they move.
- The top level of the vertical scale of the histogram depends on the height of the formed Bars.
- The Bars height is measured upward from a zero line (by default, this Bars vertical scale is set to start at zero). However, It does not have a limit to the maximum it can reach.
Of course, there is a big difference between the values for each of the two previous differences, and therefore you should use the sensitive input to enlarge the small values and make them consistent with the big values to know when to enter and when to exit.
Waddah Attar Explosion MT4 Indicator explained, how it works?
1. The Golden Line:
- Its task is to know when the price explosion will start and when it will end.
- The price explosion begins when the Golden Line is at its lowest value, and then it begins to go up.
- The price explosion continues as long as the Golden Line remains high.
- The price explosion ends when the Golden Line returns to the lowest values again and become horizontal.
- The Golden Line function ends once the determining of the beginning and the end of the price explosion was done, without specifying the trend direction which is the function of the Histogram with his Green and Red Bars.
2. The Histogram Green Bars: Has Three Tasks.
- The first task is to identify the Uptrend.
- The second task is to specify the entry point (the Buying Point), which is when the Green Bar rises above the Golden Line .
- The third task is to specify the Exit Point, which is when the Green Bar drops below the Golden line.
3. The Histogram Red Bars: Has Three Tasks.
- The first task is to identify the Downtrend.
- The second task is to specify the entry point (the Selling Point), which is when the Red Bar rises above the Golden Line .
- The third task is to specify the Exit Point, which is when the Red Bar drops below the Golden Line.
4. The White Dotted Line:
- Represents the upper limit of the Dead zone, below this line no order should be opened.
- It works as a filter for weak signals and no alert will be shown when the red or green histogram are under it.
Explosion MT4 Indicator Overview:
The market movements relate directly to the color of the Histogram Bars: Green Bars ⇒ Uptrend | Red Bars ⇒ Downtrend.
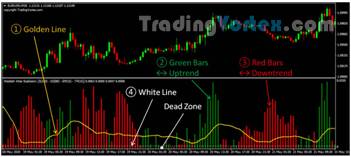 Click on the image above to open the full size version
As seen in the example above:
- If the Red Bar is too long, the Downtrend is strong and if the Green Bars is too long, the Uptrend is strong.
- The Golden Line drawn on the Histogram chart also helps to show the strength of the current trend in the market: the line will tend to form a dome shape when the strength is high.
Recommendations for Waddah Attar Explosion:
Which Currency Pairs to trade?
You can use this indicator with any currency pair, but as usual, the indicator perform best with major currency pairs.
What is the best Trading Session for this indicator?
This indicator gives the best performance during the American and European sessions. Stay away from the Asian session where the explosions are usually weak.
It is the News Releases that creates the price explosions. Therefore, the best way to work with this indicator is to know when important news is released, then monitor the indicator at the optimal time and enter according to its signal.
Which Time-frame to use?
The best time-frame is 30 minutes. in case you choose to use it on bigger time-frames you should increase your stop-loss.
Personally, I recommend using it on the 30 minutes time-frame according to 4H time-frame trend.
Waddah Attar Explosion MT4 Installation:
Step 1:
- Open your MT4 platform.
Click on File then Open Data Folder. Here you will find a folder called MQL4, this is the new “home” for all your .ex4 or .mq4 files you have.
Open folder MQL4. Here you will find Indicators folder. Copy your Waddah Attar Explosion Indicator file "Waddah_Attar_Explosion.ex4" into MQL4/Indicators folder. Do this by right clicking on the file and clicking “copy” and then “paste”.
Restart your MT4.
Click on the image below to open the full size version!
Step 2:
- Open the MetaTrader 4 platform, and click on: → View → Navigator. You can also press CTRL+N.
- When the window titled 'Navigator' will appear click on 'Indicators'.
Click on the image below to open the full size version!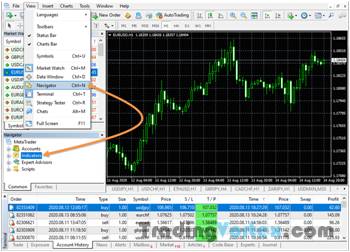
Step 3:
You should see the "Waddah_Attar_Explosion" file in the Indicators folder. Double click on it and click OK to load it onto your chart.
Waddah Attar Explosion Settings:
Indicator Settings Explanation:
Click on the image below to open the full size version!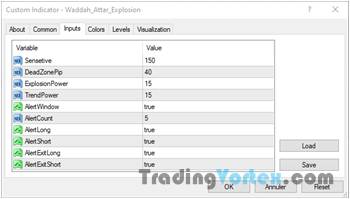
Sensetive:
- The rule says the smaller the time frame, the smaller the sensetive value should be.
- The sensetive value suitable for almost all pairs stay between 75-125.
- If the price moves slowly or you choose a larger time frame, the sensetive value should be increased.
- This number should be adjusted to suit the pair and the trader as well.
DeadZonePip:
- Represents the height of the dead zone in number of pips.
- This area is limited by the white dotted line.
- This input is very important because no entry signal will be given in this zone.
ExplosionPower:
- This input represents the explosion power level at which the indicator will alert us.
- The entry signal will be given if the explosion power becomes equal to or greater than its value.
TrendPower:
- It represents the strength of the trend inclination at which the indicator will alert us.
- If the trend power becomes equal to or greater than its value the entry signal will be given.
AlertWindow:
- True ⇔ show the alert windows.
- False ⇔ hide the alert windows.
AlertCount:
The number of alarms for each entry or exit and for each pair separately.
AlertLong:
- True ⇔ enable the buy entry alert.
- False ⇔ disable the buy entry alert.
AlertShort:
- True ⇔ enable the sell entry alert.
- False ⇔ disable the sell entry alert.
AlertExitLong:
- True ⇔ enable the buy exit alert.
- False ⇔ disable the buy exit alert.
AlertExitShort:
- True ⇔ enable the sell exit alert.
- False ⇔ disable the sell exit alert.
Waddah Attar Explosion Best Settings:
These parameters were tested on 30 minutes time-frame chart.
- Sensetive optimal value: 150.
- DeadZonePip optimal value: 40.
- ExplosionPower optimal value: 15.
- TrendPower optimal value: 15.
- AlertCount optimal value: up to you (I recommend “5”).
How to use Waddah Attar Explosion Indicator for trading?
There are certain General Rules to which you must conform when you trade using the Waddah Attar Explosion indicator:
- The length of the Histogram Bars (Green and Red bars in the indicator chart) must be above the Golden colored line.
- The Tilt Power must increase by at least 15%: this ratio corresponds to the difference between the length of the last Red or Green Histogram bar and the length of the bar with the same color immediately preceding it.
- The Explosion Power which is the ratio of the increase in the last value of the Golden line over the previous one, should increase by at least 15%. It corresponds to the spacing between the Bollinger bands.
- The Histogram Bars (Green & Red bars) and the Golden line must be over the Dead zone.
- When a Green bar is generated, Buy orders can be placed.
- When a Red bar is generated, Sell orders can be placed.
- The entry should be executed immediately at the beginning of the signal, so do not wait for the opening of the next candle if not you risk losing some or all of your profit.
Buy Signal Rules:
Buy triggers when all of the below conditions are met:
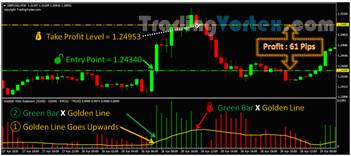
- The Golden Line goes upwards marking the start of the explosion.
- Histogram bars should be Green and cross the Golden line from bottom to top.
- This intersection must occur above the dead zone.
- When all of these conditions are met, immediately open a buy order.
There are two ways to close buy orders:
- When the green histogram bar crosses the golden line from top to bottom.
- If this intersection occurs immediately after the trade opening, you can wait until the Histogram Bars Turn Red to close the buy order.
Buy Order Example:
Sell Signal Rules:
Sell triggers when all of the below conditions are met:
- The Golden Line goes upwards marking the start of the explosion.
- Histogram bars should be Red and cross the Golden line from bottom to top.
- This intersection must occur above the dead zone.
- When all of these conditions are met, immediately open a buy order.
There are two ways to close sell orders:
- When the red histogram bar crosses the golden line from top to bottom.
- If this intersection occurs immediately after the trade opening, you can wait until the Histogram Bars Turn Green to close the buy order.
Sell Order Example:
You can decide to use stop level when trading, or you can decide to close your orders when there is an opposite signal; it depends on how you want to trade.
 Waddah Attar Explosion Free Download:
Waddah Attar Explosion Metatrader4 Indicator | 16.12 Ko | 16/08/2020 | 14:56







 TradingVortex.com® 2019 © All Rights Reserved.