FX Vortex Indicator Overview:
Click on the image to open the full size version!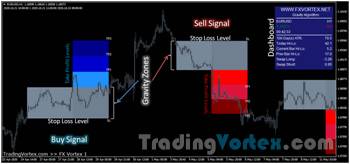
- Fx Vortex algorithm main task is to look for gravity zones and generate Buy/Sell signals with exact Stop Loss and Take Profits location. After a signal has been generated on the chart, it will not change in any way.
- Stop Loss level is always printed on the opposite side to the signal with enough space to allow small pullbacks and making a profit.
- Each signal gives us 3 different take profit levels. This number is not accidental, because it reflects every type of trader from a very conservative one, through a standard one to a much more favorable RR ratio.
- The system is also equipped with a Trading Dashboard which will assist you during your trading. It provides important information like: trading pair, time-frame, time to the next candle, spread value, ATR values from XXX days, current ATR values, Swap value.
- When a new signal arises to your chart, the indicator can also send email alerts and real time notifications to your mobile phone so that you can still make profit while being away from your computer.
Click on the image to open the full size version!
Recommendations for FX Vortex Indicator:
Which Currency Pairs to trade?
You can use this indicator with any currency pair, but as usual, the indicator perform best with major currency pairs.
What is the best Trading Session for this indicator?
It can be used for all sessions, but you need to select the appropriate template based on the market volatility. See how below!
The system provides 4 Different Templates, Which One To Use?
- If you prefer standard trading, use the FXVORTEX1, FXVORTEX2. These templates are also recommended for low volatility markets.
- FXVORTEX3 and FXVORTEX4 templates were recently added to respond to the drastic increase in market volatility following the COVID-19 pandemic. It is recommended to use these templates as the standard one till the markets go back to standard volatility. They are also recommended for high volatility markets.
- If you are having trouble identifying the high volatility market, just apply the FXVORTEX1 template and if you see a small number of signals, check the FXVORTEX3 or FXVORTEX4 template.
What Time-Frame should I trade?
It depends on your trading style:
- If you prefer fast Scalping use M1-M5 time-frames.
- If you like typical Day trading, you can focus on M5-H1 time-frames.
- If you like slow Swing trading check the signals on H1/H4/D1 time-frames.
How long does the Signal is Valid, after the colored boxes are printed on the chart?
The signal is valid until the price hits Stop loss (SL) or Take profit 3 level (TP3), or when the next signal is created.
Which Take Profit level should I choose?
- The simplest method is to observe the price. If it moves quickly and dynamically, we can usually count on Take Profit3 (TP3).
- If it has difficulties with volatility, or the market is just about to close an important trading session (like EU or US), it’s better to aim for lower values like TP1 or TP2.
What should I do if I miss the entry?
If the price is far from the entry point you should wait for the next signal.
What Lot Size should I use when trading this system?
You should always control your risk. Most traders use 1-2% of their account for any opened transaction.
FX Vortex Indicator MT4 Installation:
Step 1:
- Open your MT4 (MetaTrader 4) platform.
Click on "File" then "Open Data Folder". Here you will find a folder called "MQL4", this is the new “home” for all ".ex4" or ".mq4" files you have.
Open the folder "MQL4". Here you will find "Indicators" folder, where you should put all the 5 indicators present in the "Indicators" folder downloaded from our site. Do this by right clicking on each file and clicking “copy” and then “paste”. - The folder called "templates" is the home for all your ".tpl" files: put "FXVORTEX1.tpl, FXVORTEX2.tpl, FXVORTEX3.tpl & FXVORTEX4.tpl" here.
Restart your MT4.
Click on the image to open the full size version!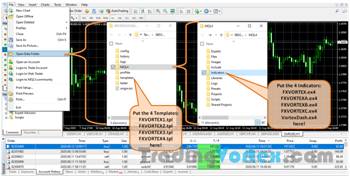
Step 2:
- Open the MT4 (MetaTrader 4) platform, and click on: "View/Navigator". You can also press CTRL+N.
- When the window titled "Navigator" will appear click on "Indicators".
- You should found the "FXVORTEX", "FXVORTEXA", "FXVORTEXB", "FXVORTEXC" & "VortexDash" files under this folder.
Click on the image to open the full size version!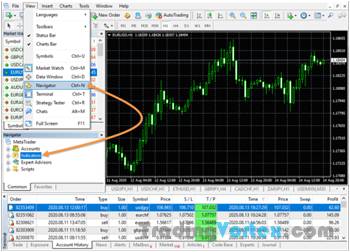
You don't have to load the indicators separately on your chart, The templates included in the downloaded package will do the job for you.
How to Setup FX Vortex Indicator?
When the 4 indicators are installed successfully, all what you have to do is apply one of the 4 templates (FXVORTEX1.tpl, FXVORTEX2.tpl, FXVORTEX3.tpl & FXVORTEX4.tpl) provided with this indicator to your chart.
To launch the desired template:
- Click on "Templates" button to display the list of templates present on your platform: you should see FXVORTEX1, FXVORTEX2, FXVORTEX3 & FXVORTEX4 on this list.
- Select one of the 4 FXVORTEX Templates on the dropdown list depending on the Volatility
- Once applied, the name of the selected template will be displayed at the bottom left of your chart.
- If one of these templates doesn't exist, confirm its presence inside the folder called templates under Open Data Folder and restart your MT4 terminal.
Click on the image to open the full size version!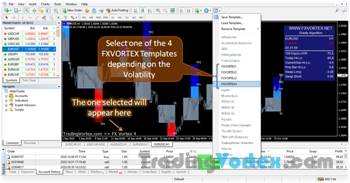
How To Use the FX Vortex Indicator?
This all-in-one Indicator generates perfectly clear and legible buy and sell signals that appear right on your chart. You don't have to wonder about anything, just follow the rules detailed below.
The Buy and Sell signals work the same, with the only difference that the take profit levels are set to the downside for Sell trades and to the upside for Buy trades.
Buy Signal Rules:
Buy triggers when all of the below conditions are met:
- A grey rectangle appears on the chart: the algorithm detects a possible opportunity to open a trade and Waits for a valid buy signal. This is the place where the price is getting ready for further move.
Colorful blue squares on the chart: the signal is produced when the price leaves the narrow range and broke to the upside. The squares shows the exact Stop Loss (SL) and Take Profits (TP1/TP2/TP3) levels.
Stop Loss level is always printed on the opposite side to the signal. However, if it's too small for you, you can move the SL for a few pips more for example to the round level or an important resistance level.
The trade should remain open until it hits the Stop Loss or one of the Take Profit levels:
- For High volatility markets: you can target the TP3 level.
- For Low volatility markets: aim for TP1 or TP2 level as a target.
BUY Trade Example:
The indicator is waiting for a valid Buy Signal ⇒ A grey rectangle appears on the chart:
Click on the image to open the full size version!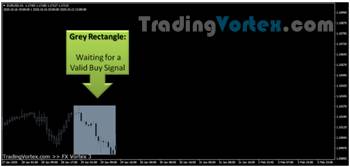
The price leaves the narrow range and broke to the upside ⇒ Buy Signal produced:
Click on the image to open the full size version!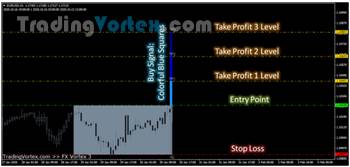
In this example the price has exceeded the Take Profit 3 (TP3) level ⇒ 52 Pips as profit:
Click on the image to open the full size version!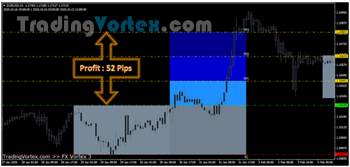
Sell Signal Rules:
Sell triggers when all of the below conditions are met:
- A grey rectangle appears on the chart: the algorithm detects a possible opportunity to open a trade and waits for a valid sell signal. This is the place where the price is getting ready for further move.
Colorful red squares on the chart: the signal is produced when the price leaves the narrow range and broke to the downside. The squares shows the exact Stop Loss (SL) and Take Profits (TP1/TP2/TP3) levels.
Stop Loss level is always printed on the opposite side to the signal. However, if it's too small for you, you can move the SL for a few pips more for example to the round level or an important support level.
The trade should remain open until it hits the Stop Loss or one of the Take Profit levels:
- For High volatility markets: you can target the TP3 level.
For Low volatility markets: aim for TP1 or TP2 level as a target.
Sell Trade Example:
The indicator is waiting for a valid Sell Signal ⇒ A grey rectangle appears on the chart:
Click on the image to open the full size version!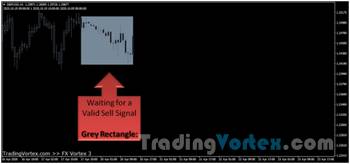
The price leaves the narrow range and broke to the downside ⇒ Sell Signal produced:
Click on the image to open the full size version!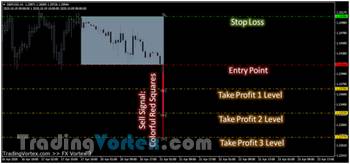
In this example the price has exceeded the Take Profit 3 (TP3) level ⇒ 139 Pips as profit:
Click on the image to open the full size version!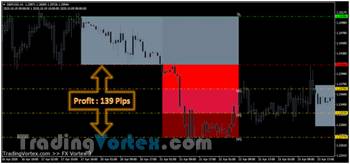
FX Vortex Indicator Free Download:
FX Vortex Indicator for Metatrader4| 180.21 Ko| 23/10/2020, 19:24





 TradingVortex.com® 2019 © All Rights Reserved.